
The El Niño Briefing #10: +3.2 °C, and the odds of a historic event rise to 83%
Updated: October 9, 2026 · 2 min read · Live dashboard
Numbers of the week
As sent on Oct 9, 2026 — not updated since.
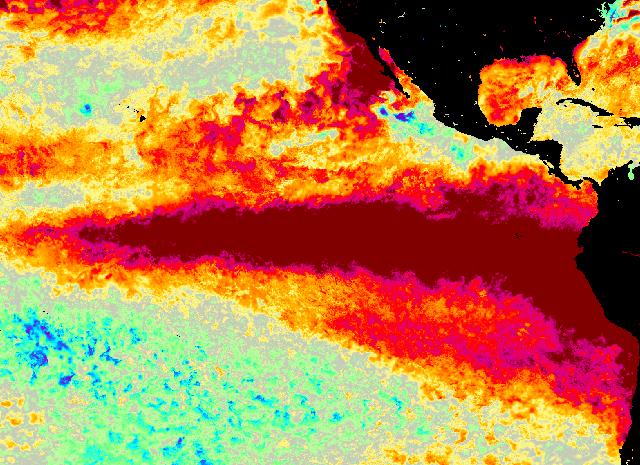
NOAA's weekly Niño 3.4 reached +3.2 °C for the week centred 30 September. That's the second record in a row: +3.1 °C the week before, and +3.0 °C before that, which only tied 18 November 2015. The series runs back to September 1981, 2,353 weeks, and no week outside this year got above +3.0 °C.
Then on Thursday CPC moved its odds.
83%, up from 75%. CPC's 8 October discussion puts the chance of a historic event (a three-month RONI of +2.5 °C or more, stronger than any El Niño since 1950) at 83% for October–December. In September it was 75% for the same season. This time it also gave the seasons either side: 54% for September–November, 70% for November–January. The summary line says El Niño "continues to strengthen", with a strong-to-very strong event likely through January–March 2027.
Further east, further off the chart. Niño 3 reads +4.0 °C. Its best week before this year was +3.3 °C, in November 1997. Off Peru and Ecuador, Niño 1+2 is at +5.3 °C; outside 2026 the top week was +4.5 °C, in late June 1983. The western box, Niño 4, is the exception at +1.2 °C, against +1.7 °C in November 2015 and November 2023. So it isn't a record everywhere. It's three regions out of four.
The same week in 1997 and 2015. Niño 3.4 read +2.0 °C in both: the week centred 1 October 1997 and the week centred 30 September 2015. Those events then peaked at +2.3 °C (December 1997) and +3.0 °C (November 2015). This one is past both peaks with September barely over.
The relative indices agree. The Bureau of Meteorology's relative Niño 3.4, which takes out the warming of the tropical oceans as a whole, is at +2.83 °C for the week ending 4 October, up from +2.72 °C, against its El Niño threshold of +0.8 °C. NOAA's own relative index, the three-month RONI, came in at +1.69 for July–September (June–August: +1.36). The conventional ONI for the same season is +2.16 °C. RONI always trails the weekly numbers: it's a three-month average, published after the season closes.
Two corrections. Issue #7 called the week of 9 September "+2.9 °C, the warmest September week". NOAA has since revised that week to +2.8 °C. And our El Niño 2026 timeline said the +0.5 °C threshold was crossed in May. NOAA's current file puts the first week at or above it on 15 April; the timeline now follows the file.
Next. NOAA's weekly file updates on Monday 12 October with the week centred 7 October. CPC's next discussion is due on 12 November.
Live dashboard → · Live map → · Event log →
— The El Niño Briefing
Keep reading
The El Niño Briefing
The weekly plain-language digest of the 2026–27 El Niño.
El Niño 2026: Tracking a Potential Super El Niño in Real Time
Declared in June, already strong by July, and forecast to peak in the Northern Hemisphere winter — the definitive guide to the 2026–27 event and its super-El-Niño odds.